Essential eCommerce metrics every store owner should track
Tracking every available data point won't grow your online store—focusing on the right ecommerce metrics will. This guide cuts through the noise to highlight the key performance indicators that actually drive revenue, from conversion rates and customer engagement to often-overlooked product-level KPIs.
Dotidot Editors
March 20, 2026
Show table of contents
The metric overload problem
Modern ecommerce platforms and analytics tools provide access to hundreds of data points. From scroll depth to micro-conversions, every user action can be measured. Yet this abundance of data often creates more confusion than clarity. Store owners find themselves drowning in numbers without understanding which ecommerce metrics actually matter for their business growth.
The result is reactive decision-making. Instead of building a strategic approach to optimization, merchants jump from one metric to another, chasing small improvements without understanding the bigger picture. The solution is not tracking more metrics—it is tracking the right ones and understanding how they connect to your business goals.
Revenue metrics
Revenue metrics form the foundation of your ecommerce KPIs list. These numbers tell you whether your store is financially healthy and growing.
Gross Revenue: The total value of all sales before any deductions. While simple, this metric shows overall business volume and seasonal trends.
Net Revenue: Revenue after returns, discounts, and refunds. This is a more accurate picture of what your business actually earns.
Average Order Value (AOV): Total revenue divided by the number of orders. Increasing AOV through upselling, cross-selling, or bundling can significantly impact profitability without acquiring new customers.
Revenue Per Visitor (RPV): Total revenue divided by total visitors. This combines traffic quality and conversion effectiveness into one metric, making it useful for comparing different marketing channels.
Customer Lifetime Value (CLV): The total revenue you can expect from a single customer over their entire relationship with your store. This metric helps justify customer acquisition costs and guides retention strategies.
Conversion metrics
Conversion rate ecommerce tracking is where most store owners should focus their optimization efforts. These metrics reveal how effectively you turn visitors into customers.
Overall Conversion Rate: The percentage of visitors who complete a purchase. Industry averages typically range from 1-3%, but this varies significantly by niche and traffic source.
Add-to-Cart Rate: The percentage of visitors who add at least one item to their cart. A low add-to-cart rate suggests problems with product pages, pricing, or product-market fit.
Cart Abandonment Rate: The percentage of shoppers who add items to cart but leave without purchasing. The global average hovers around 70%, making this a critical area for optimization.
Checkout Abandonment Rate: Similar to cart abandonment, but specifically measures drop-offs during the checkout process. High rates here often indicate issues with payment options, shipping costs, or trust signals.
Tip: Segment your conversion rate by traffic source and device type. Mobile users often have different conversion patterns than desktop users, and paid traffic may convert differently than organic visitors. This segmentation reveals specific areas for improvement.
Engagement metrics
Engagement metrics help you understand how visitors interact with your store before they decide to buy or leave.
Session Duration: How long visitors spend on your site. Longer sessions generally indicate higher interest, though this must be interpreted alongside other metrics.
Pages Per Session: The average number of pages viewed during a visit. For ecommerce, more pages often means customers are exploring products, which correlates with higher purchase intent.
Bounce Rate: The percentage of visitors who leave after viewing only one page. High bounce rates on product pages suggest mismatched traffic or poor page experience.
Product Page Views: Tracks which products attract the most attention. Combined with conversion data, this reveals which products have high interest but low sales—potential optimization opportunities.
Site Search Usage: What visitors search for on your site. This data reveals demand for products you may not be promoting effectively and helps improve navigation.
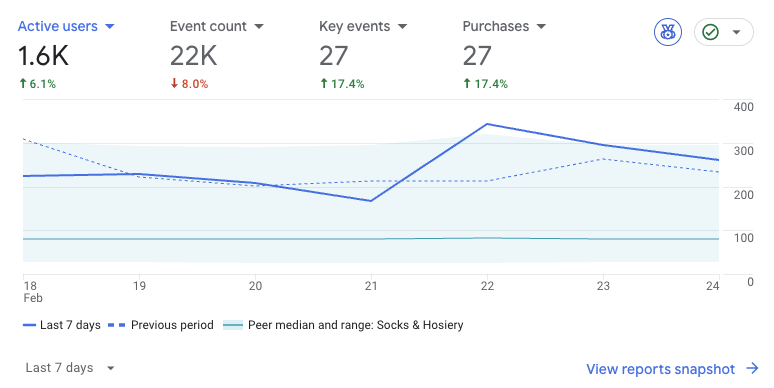
Most of the mentioned metrics can easily be tracked by Google Analytics 4
Product-level KPIs
Product-level ecommerce metrics are often overlooked, yet they are essential for maximizing inventory performance and making smarter merchandising decisions.
Sell-Through Rate: The percentage of inventory sold within a specific period. This helps identify slow-moving products that may need promotions or removal from your catalog.
Product Revenue Share: Each product's contribution to total revenue. Understanding which products drive your business helps prioritize marketing spend and inventory investments.
Product Conversion Rate: Conversion rate calculated for individual products. Some products convert visitors much better than others, and this data informs which items to feature in campaigns.
Click-to-Purchase Ratio: For paid advertising, this shows how many clicks it takes to generate a sale for each product. Products with poor ratios may need better ad creative or landing page optimization.
Zero-Click Products: Items in your catalog that receive impressions but no clicks. These Zombie products drain budget in shopping campaigns without contributing revenue. Identifying and addressing them is crucial for campaign efficiency.
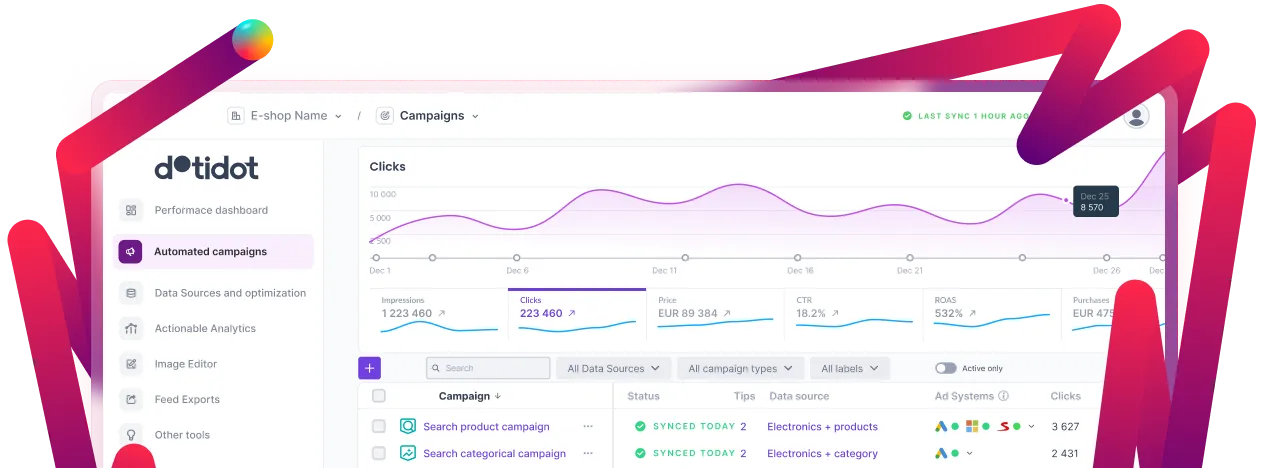
Effective product feed management enables you to track and act on these product-level metrics by maintaining clean, enriched data across all your sales channels.
These key ecommerce metrics measure how effectively your marketing budget generates returns.
Customer Acquisition Cost (CAC): The total cost of acquiring a new customer, including all marketing and sales expenses. Compare this to CLV to ensure sustainable growth.
Return on Ad Spend (ROAS): Revenue generated for every dollar spent on advertising. A ROAS of 4:1 means you earn $4 for every $1 spent.
Cost Per Acquisition (CPA): The cost to generate a single conversion. This helps compare efficiency across different marketing channels and campaigns.
Marketing Efficiency Ratio (MER): Total revenue divided by total marketing spend. Unlike channel-specific ROAS, MER gives you a holistic view of marketing efficiency.
Blended CAC: Combines paid and organic acquisition costs. As attribution becomes more complex, this metric provides a realistic view of what customer acquisition truly costs.
Leading vs lagging indicators
Understanding the difference between leading and lagging indicators transforms how you use ecommerce KPIs for decision-making.
Lagging indicators tell you what already happened. Revenue, conversion rate, and customer count are lagging - they show past performance but do not predict future results.
Leading indicators predict future performance. Add-to-cart rate, email list growth, return visitor rate, and engagement metrics signal what is likely to happen to your lagging indicators.
A healthy dashboard tracks both. If your leading indicators improve but lagging indicators remain flat, investigate the conversion funnel. If lagging indicators drop while leading indicators stay strong, look for external factors or attribution issues.
Building a KPI Dashboard
An effective ecommerce dashboard focuses on actionable insights rather than data overload. Here is how to structure yours:
Layer 1 - Health Metrics: Revenue, conversion rate, and AOV. Check these daily to spot problems quickly.
Layer 2 - Diagnostic Metrics: Traffic by source, add-to-cart rate, cart abandonment, and bounce rate. Review weekly to understand performance drivers.
Layer 3 - Strategic Metrics: CLV, CAC, product-level performance, and cohort analysis. Analyze monthly to guide long-term decisions.
Choose 5-7 primary KPIs that align with your current business goals. A new store focused on growth will prioritize different metrics than an established store optimizing profitability.
Tip: Set up automated alerts for significant metric changes. A sudden drop in conversion rate or spike in cart abandonment should trigger immediate investigation rather than waiting for your weekly review.
Turning metrics into decisions
Data without action is just numbers. Here is a framework for converting ecommerce metrics into strategic decisions:
Identify the gap: Compare current performance to your target or benchmark. A 2% conversion rate matters differently if your goal is 2.5% versus 4%.
Diagnose the cause: Use supporting metrics to understand why the gap exists. Low conversion with high add-to-cart suggests checkout issues. Low conversion with low
Coming soon:
Product analytics
Now you can track, compare, and optimize product performance across all your campaigns in one place. Try it out!