Analysis: 88 brands. 9 industries. One pattern. Half the budget is wasted
We analyzed Product Analytics data from 88 e-commerce brands across Google Ads and Meta, covering 9 industry verticals in the EU and US. The findings are consistent. And uncomfortable.
Martina Pribylova
March 24, 2026
Show table of contents
Methodology:Based on 88 unique brand/channel pairs generating 162 reports in Q4 2025–Q1 2026. Each brand counted once per channel. Verticals with fewer than 6 brands are directional only.
Nearly half your budget is funding the wrong products
Across all 88 brands, an average of 48.4% of total ad spend was allocated to products with below-threshold ROAS. The median sits at 49.9%. The worst case in the dataset: 95.9%.
That's not a campaign problem. That's a visibility problem.
Most teams optimize at the campaign or ad group level: Adjusting bids, creatives, and audiences. But the waste isn't there. It's one level deeper, inside the product data, where no one is looking.
~79% of your catalog is invisible
Here's the second problem hiding inside the same accounts.
On average, only 21.6% of promoted products receive meaningful traffic. The remaining ~79% are effectively invisible: zero impressions, zero clicks, zero chance to perform.
In the best-performing account in the dataset, active product share reached 82%
In the worst, it was 0.3%
Most brands sit somewhere in the middle — promoting thousands of products, while the algorithm quietly ignores most of them
The longer it runs, the worse it gets. The budget concentrates on a small set of proven performers. The rest of the catalog never gets tested. You never find out what it could have done.
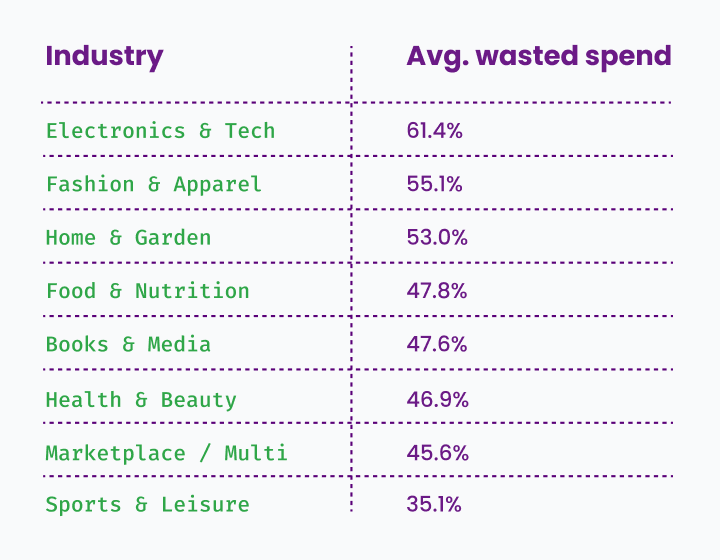
No industry is immune
We broke the data down across 8 verticals. Every single one showed significant wasted spend. The numbers only differ in how bad it gets.
Electronics & Tech brands are losing the most: 61.4% of budget on low-ROAS products, likely driven by large SKU catalogs and highly competitive auctions where the algorithm doubles down on the few products it recognizes.
Sports & Leisure performs best at 35.1%. That's the most efficient vertical in this dataset. It still means more than a third of every budget goes to products that don't deliver.
No industry escapes this pattern. The question is only where you sit on the scale.
What this means
The algorithm isn't broken. It's doing exactly what it's designed to do, which is to optimize for conversions. It doesn't know about your margins, your stock levels, or which products matter most to your business. It just follows the signal. The result, across 88 brands, is a consistent pattern:
Nearly half the budget funds products below ROAS threshold
The vast majority of the catalog never gets a real chance
Every industry is affected, some severely
The data doesn't lie. These inefficiencies exist in almost every account. Most teams simply don't have the tooling to see them.
How to start fixing it
The first step is visibility. You can't optimize what you can't measure — and most ad platforms don't surface product-level performance in a way that's actionable.
Among the 18 brands in this dataset with multiple reports tracked over time, 10 showed measurable improvement after acting on product-level data. The average reduction in wasted spend was 27.4 % achieved in under 90 days. Three cases stand out:
A Food Retail brand started with 90.5% of budget on low-ROAS products. After excluding underperformers and redirecting budget, that dropped to 48.0% — a 42.4pp reduction in 66 days across a ~9,000 SKU catalog.
A Sports Retailer with ~188,000 SKUs came in at 89.7%. Structured product segmentation across Google Ads brought it down to 53.1% in 79 days.
A Health & Beauty brand reduced wasted spend from 68.8% to 40.8% — a steady 28pp improvement tracked across 8 reports over 64 days.
These are real brands from the same dataset of 88. No special setup. No engineered results. They simply got visibility into something that was already happening and decided to change it.
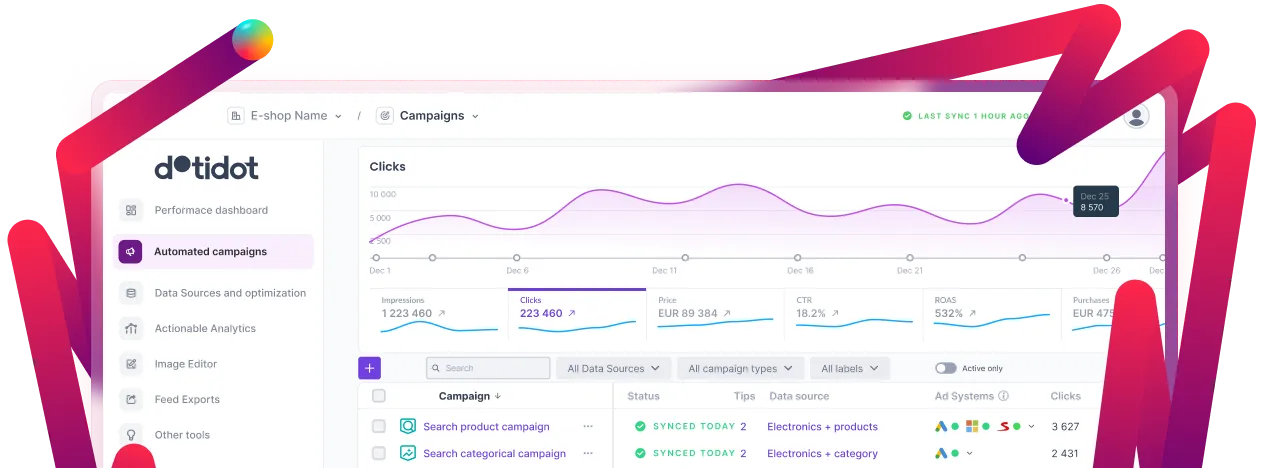
Product Analytics give you the insight
That's exactly what Product Analytics was built for. It takes your product and campaign data and turns it into clear, product-level insights: where your budget actually goes, which products are draining, and which parts of your catalog deserve more visibility.