How to find underperforming products across all campaigns
Many advertisers unknowingly waste budget on products that attract clicks but never convert. This is a problem buried deep within campaign-level reports. Product performance analysis reveals these hidden drains , helping you identify what to pause, improve, or remove.
Dotidot Editors
February 19, 2026
Show table of contents
The hidden budget drain
Every ecommerce advertiser has products that silently consume budget without delivering returns. These hidden drains accumulate over weeks and months, creating a significant gap between potential profitability and actual results. The challenge is that standard reporting dashboards rarely expose these issues at the product level.
When you analyze campaign performance, you typically see aggregated metrics—total clicks, overall ROAS, and average cost per conversion. But within those averages lie products that dramatically underperform while others carry the weight of your entire account. Product performance analysis bridges this gap by revealing which specific items deserve your budget and which ones waste it.
Why campaign-level data isn't enough
Campaign-level reporting shows you the forest but hides the trees. A campaign might report a healthy 400% ROAS overall, yet contain dozens of products with negative returns.These underperformers get masked by your bestsellers, creating a false sense of optimization.
Consider a Shopping campaign with 1,000 products. If 50 products generate 80% of revenue while 300 products consume budget without a single conversion, your campaign metrics will still look acceptable. Without drilling into individual product data, you continue funding items that will never convert.
This limitation becomes especially problematic in Performance Max campaigns, where Google's algorithm distributes budget automatically across products. Understanding which items actually perform requires moving beyond campaign summaries to product-level analysis.
Indicators of underperformance
Identifying budget drains requires tracking specific signals at the product level. Watch for these key indicators:
High impressions with low clicks: Products that appear frequently but fail to attract interest indicate weak product data or irrelevant targeting
High clicks with zero conversions: These products attract attention but fail to close, suggesting pricing issues, poor landing pages, or mismatched search intent
Conversions with negative profit margin: Some products convert but cost more to advertise than they return in profit
Declining performance trends: Products that previously converted but have stopped performing often signal market changes or increased competition
Tip: Set a threshold for minimum conversions per product over 30 days. Any item with significant spend but zero conversions during this window should be flagged for review.
The Zombie product problem
Products that receive impressions but generate zero clicks or conversions are often called Zombie products. They sit in your feed consuming potential budget allocation without contributing to results. Identifying and addressing these items can immediately improve overall campaign efficiency.
Cross-campaign Product Analysis
A single product might appear across multiple campaigns like Shopping, Performance Max, Dynamic Search Ads, and remarketing. Analyzing performance in isolation gives an incomplete picture. True product performance analysis aggregates data across all campaigns where that item appears.
This cross-campaign view reveals patterns that single-campaign analysis misses. A product might perform poorly in Shopping but convert well through remarketing. Or it might drain budget across every campaign type, confirming it should be excluded entirely.
Building this unified view requires connecting product identifiers across platforms and campaign types, then calculating combined metrics like total spend, total revenue, and overall ROAS per product.
Traffic vs Revenue comparison
One of the most revealing analyses compares each product's share of traffic against its share of revenue. Products should ideally contribute revenue proportional to the traffic they consume.
Map your products into four quadrants:
High traffic, high revenue: Your stars that deserve continued or increased investment
Low traffic, high revenue: Hidden gems that might benefit from more exposure
High traffic, low revenue: Budget drains requiring immediate attention
Low traffic, low revenue: Either neglected opportunities or products to consider removing
This framework quickly identifies where budget reallocation will have the greatest impact. Products consuming 10% of clicks but generating only 1% of revenue represent clear optimization targets.
Profitability signals
ROAS alone can mislead your product performance analysis. A product with 500% ROAS sounds excellent, but if your margin on that product is only 10%, you might still lose money on every sale.
Incorporate these profitability metrics into your analysis:
Profit per conversion: Actual margin remaining after ad costs and product costs
POAS (Profit on Ad Spend): Measures actual profit return rather than just revenue
Customer lifetime value considerations: Some low-margin products lead to high-value repeat customers
Understanding your POAS strategy helps you make decisions based on actual business impact rather than vanity metrics.
Decision Framework: Pause, Improve, or Remove
Once you identify underperforming products, apply a structured decision process:
Pause
Temporarily exclude products that drain budget but might recover with changes. This applies to seasonal items outside their peak period, products with temporary stock or pricing issues, or items awaiting feed data improvements.
Improve
Some products underperform due to fixable problems. Consider improving product titles and descriptions for better relevance, updating images to increase click-through rates, adjusting pricing to match market expectations, or enhancing landing page experience to boost conversions.
Remove
Permanently exclude products that consistently fail despite optimization attempts. Items with fundamental issues—low margin, high competition, or poor product-market fit—should exit your advertising feed entirely.
Tip: Before removing products, test excluding them from paid campaigns for 30 days while monitoring organic performance. Some products convert through organic search and don't need paid support.
How to fix it: Product-level reporting
The fix is simple. You need to start doing product-level reporting. Which means downloading product data from your ad system and building reports around it. Or you can…
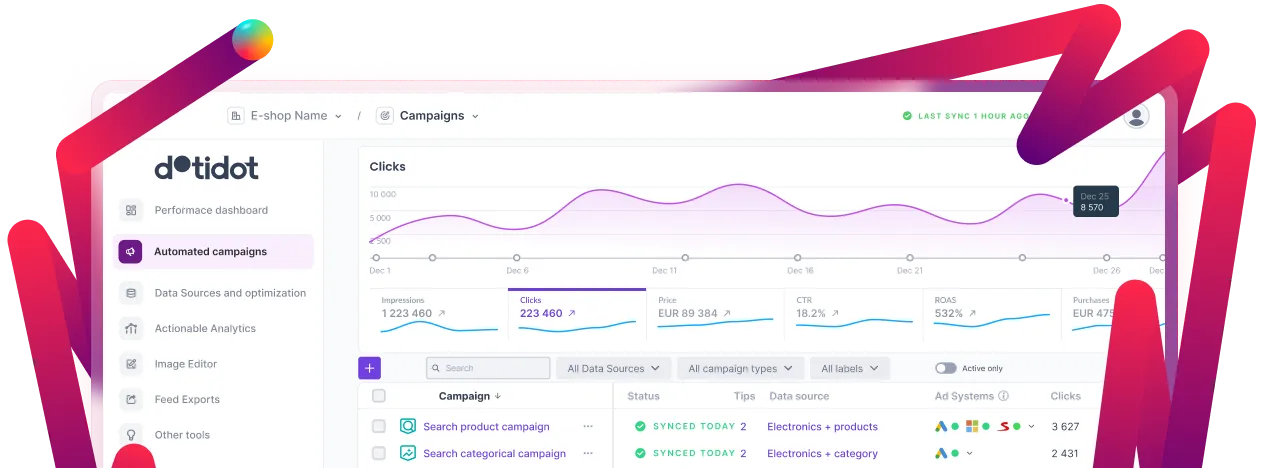
Introducing Product Analytics
That is exactly why we built Product Analytics, a tool that turns your product and campaign data into clear insights.
Product Analytics will completely change the game in your favor
It shows you:
Where your budget really goes
Which products waste money
Which items deserve more visibility
How to balance your portfolio for better results
Product Analytics gives you the data you need to act, not just analyze. If you want to see where your own campaigns hide these inefficiencies, try Product Analytics for free and uncover insights that help you optimize smarter.
Conclusion
Product performance analysis transforms how you manage advertising budgets. By moving beyond campaign-level metrics to examine individual product contributions, you uncover hidden inefficiencies that aggregate reporting masks. The products draining your budget today represent tomorrow's savings—and potentially the resources needed to scale your actual winners. Implementing systematic product-level monitoring, whether manual or automated, creates a foundation for sustained advertising profitability.
Coming soon:
Product analytics
Now you can track, compare, and optimize product performance across all your campaigns in one place. Try it out!